The Dashboard Everyone Checks (and Nobody Questions)
Open any brand’s social media report. Page one, top line, bold font: Engagement Rate.
It’s the metric every CMO asks about, every agency reports on, and every intern calculates religiously on Monday mornings. And for most brands, it’s telling them almost nothing useful about growth.
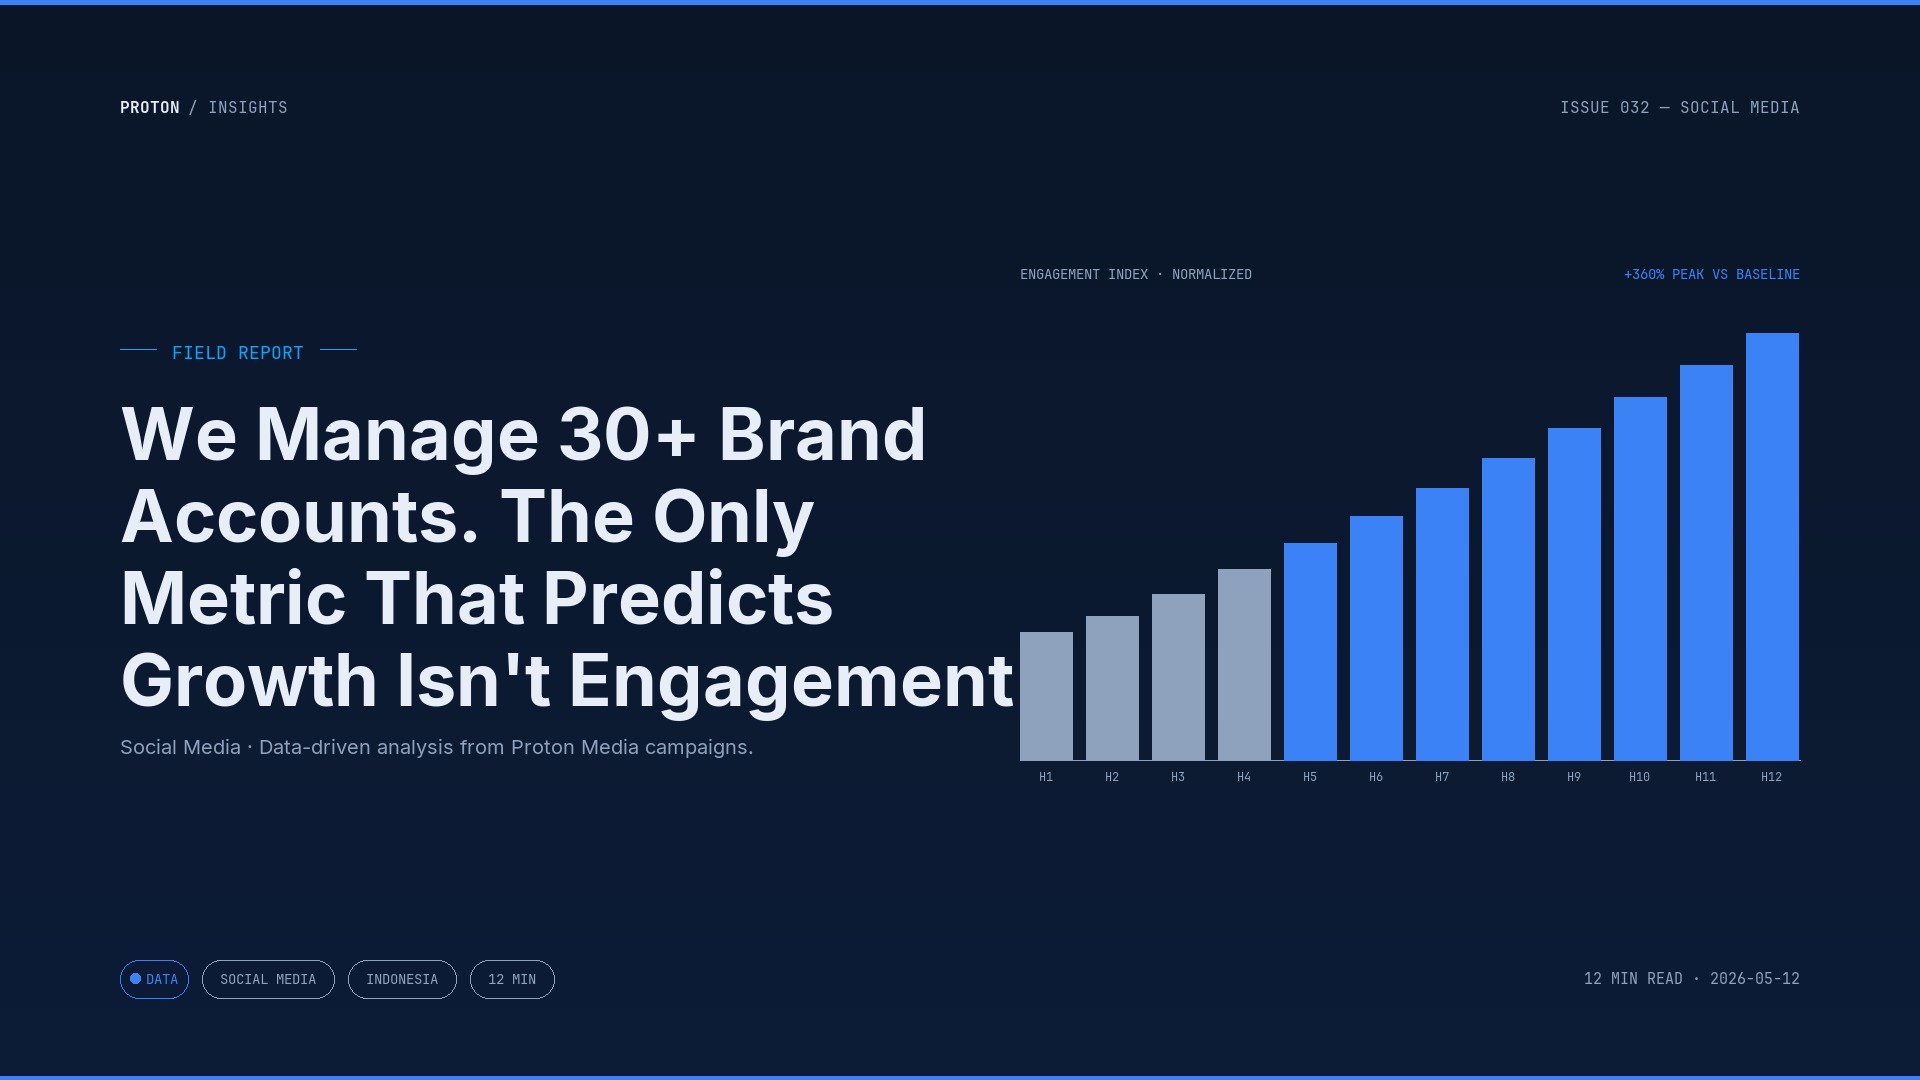
We manage over 30 brand accounts across beauty, F&B, fashion, and consumer electronics. We’ve tracked every metric available for the past three years. And the metric that actually predicts whether an account will grow next month isn’t engagement rate.
It’s Share Rate.
Why Engagement Rate Lies to You
Engagement rate — likes, comments, and saves divided by followers — tells you how your current audience responds to your content. That’s it. It’s an inward-facing metric. It measures the temperature of the room you’re already in.
Here’s the problem: a high engagement rate doesn’t mean new people are finding you.
We had a fashion brand with a consistent 5.2% ER on Instagram. The marketing team was celebrating. But their follower growth was flat for four straight months. Their content was performing — for the same 3,000 people who always liked their posts.
Meanwhile, a skincare brand with a 2.1% ER was gaining 4,000+ new followers per month. The difference? Their share rate was 3x higher.
What Share Rate Actually Tells You
When someone shares your post — to a story, to a friend via DM, to a group chat — they’re doing something fundamentally different from liking or commenting. They’re putting their reputation behind your content.
A like says “I saw this.” A share says “You need to see this.”
Shares are the only engagement action that pushes your content outside your existing audience. They’re algorithmic fuel on every platform:
- Instagram prioritizes content with high DM shares in Reels distribution
- TikTok uses share rate as a key signal for For You Page amplification
- LinkedIn treats shares as the highest-weight engagement signal for feed ranking
From our data across 30+ accounts: posts with a share rate above 2% of reach consistently appear on Explore/FYP pages. Posts below 0.5% almost never do — regardless of how many likes they get.
The Content That Gets Shared (It’s Not What You Think)
We audited 6 months of content across our managed accounts — roughly 3,600 posts. The patterns were clear.
Content that gets high likes but low shares:
- Aesthetic product flatlays
- Motivational quotes with brand colors
- “Happy Monday” type filler posts
- Perfectly polished brand imagery
Content that gets shared:
- Data or stats that surprise people. “Indonesia has 12 twin-date campaigns per year. Here’s why only 3 of them matter for your category.”
- Practical how-tos with specific steps. Not “5 tips for better content” — more like “Here’s the exact caption framework we use for product launches.”
- Opinion pieces that validate what the reader already suspects. When someone shares your post saying “CEOs need to stop chasing followers,” they’re really saying “See? I’ve been saying this.”
- Localized insights. Anything Jakarta-specific, Ramadan-specific, or payday-specific gets shared in team group chats.
The common thread? Shareable content makes the sharer look smart, informed, or ahead of the curve.
How to Shift Your Strategy
You don’t need to overhaul your entire content calendar. You need to adjust the mix.
The 40/40/20 rule we use:
- 40% share-optimized content: Data, frameworks, opinions, how-tos. These drive growth.
- 40% community content: Polls, questions, behind-the-scenes, replies. These maintain engagement.
- 20% brand content: Product shots, promos, launches. These convert.
Most brands run 80% brand content and wonder why their audience isn’t growing. You’re speaking to the converted. The algorithm isn’t going to help you if your content only appeals to people who already follow you.
Quick test: before publishing any post, ask yourself — “Would someone send this to a colleague or friend?” If the answer is no, it’ll get likes from your existing followers and nothing else. Adjust the hook, add a stat, or reframe it as an opinion before posting.
The Number Most Reports Are Missing
Here’s the fix for your next monthly report. Add one row:
Share Rate = (Shares + DM Sends) / Reach x 100
Track it for 30 days. You’ll notice your “best” posts (highest likes) and your most valuable posts (highest shares) are almost never the same content.
When we made this shift for a consumer electronics brand last quarter, their follower growth rate went from 1.2% to 4.8% per month — without changing their posting frequency or ad spend. We just changed what they posted.
The engagement rate stayed roughly the same. But the audience actually grew.
That’s the difference between a metric that makes you feel good and a metric that makes your business grow.
Your content is performing — but is it growing? If your follower count has plateaued despite “good” engagement numbers, the fix might be simpler than you think. Let’s look at your data together.