You Just Burned Rp 5 Million. Here’s Where It Went.
You launched a Meta campaign last Monday. Budget: Rp 5 million. Objective: WhatsApp conversations. Result: 3 chats. One was a wrong number.
Sound familiar?
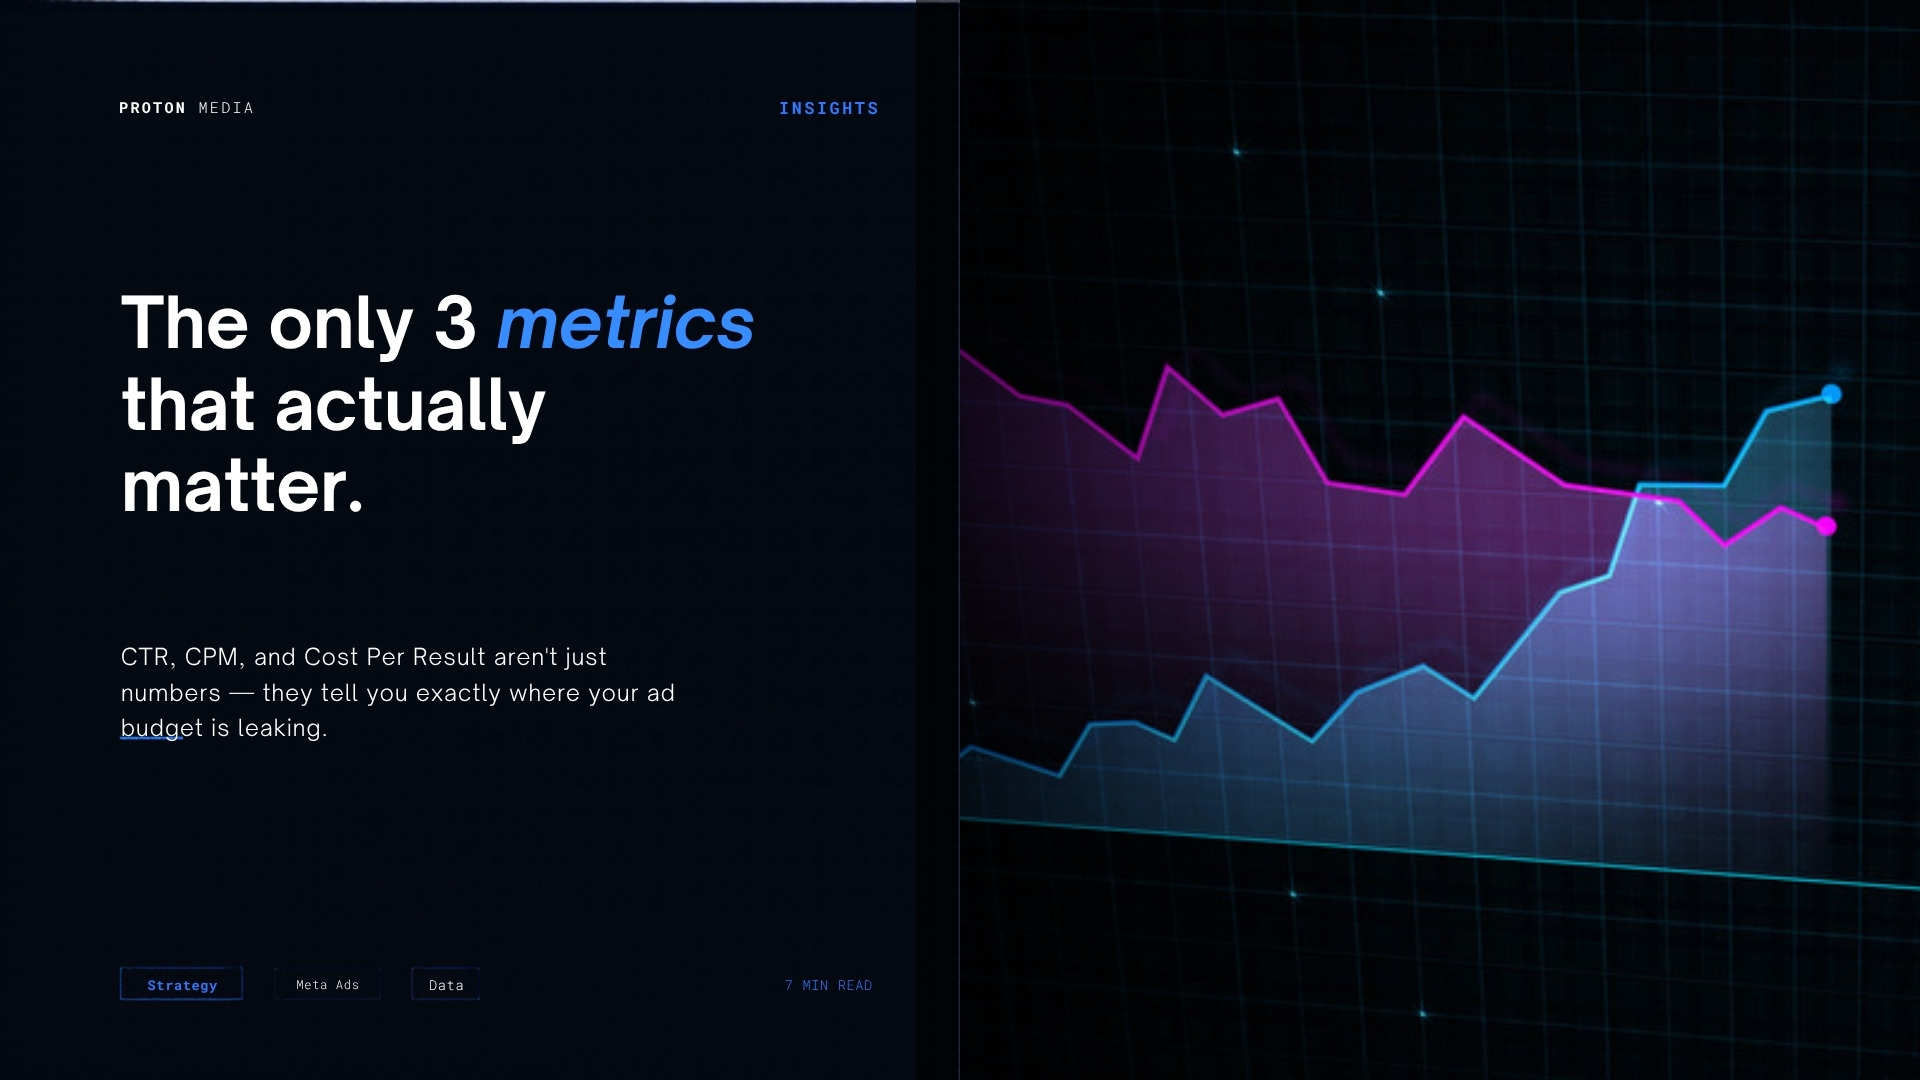
The instinct is to blame the algorithm, the audience, or the creative. But the real answer is almost always hiding in three numbers you probably glanced at and scrolled past: CTR, CPM, and Cost Per Result. These aren’t vanity metrics. They’re a diagnostic system. Each one tells you something different about where your money is going — and which lever to pull first.
By the end of this post, you’ll know how to read all three, what benchmarks actually matter in 2026, and how to build a 4-week optimization loop around them.
What Is CTR (Click-Through Rate)?
Formula: (Clicks ÷ Impressions) × 100
CTR measures one thing: how compelling your ad is to the people seeing it. A high CTR means your creative stopped the scroll. A low CTR means people saw your ad and kept moving.
2025–2026 benchmarks worth knowing:
- Cross-industry average: 1.5%–2.2% (WordStream, AdBacklog)
- Above 2% is strong. Below 1% means your ad or targeting is broken.
- Travel industry tends to sit lower at 1.3%–1.6% (Lebesgue)
- Median CTR across 35,000 brands hit 2.19% in 2025 — up 13.5% year-over-year (Triple Whale)
Here’s why CTR matters beyond clicks: Meta’s ad auction rewards high-CTR ads with lower CPM. The algorithm reads engagement as a quality signal and gives you cheaper distribution. It’s a flywheel — better creative → higher CTR → lower cost → more reach → more data → smarter optimization.
How to optimize CTR:
- Hook in the first 3 seconds. For video, that means the pattern interrupt happens before the thumb lifts. For static images, use headlines that create an open loop or contradict expectations.
- A/B test a minimum of 3 creatives per ad set. One winner isn’t a strategy. You need statistical signal, and you only get that with enough variants.
- Use Advantage+ Creative. Meta’s automated creative optimization can boost CTR by up to 11% by dynamically adjusting placements, text combinations, and visual elements (AdAmigo.ai).
- Monitor Quality Ranking. If it drops below “Average,” your CTR will follow. Quality Ranking is Meta’s internal grade of your ad’s perceived relevance — and it directly affects delivery.
What Is CPM (Cost Per Mille)?
Formula: Cost per 1,000 impressions
CPM tells you how expensive your audience is to reach. It has nothing to do with whether your ad is good — it’s purely a function of auction demand.
2025–2026 benchmarks:
- Global average: $6.96–$14.19 (Lebesgue, Triple Whale)
- CPM rose 20% year-over-year in 2025. The auction is getting more crowded every quarter (Triple Whale).
- Indonesia is typically 30–60% cheaper than the US market, but climbing every year as more local advertisers enter the platform.
- Beauty and Travel verticals have the highest CPMs at $12–14+.
Why CPM rises:
- More advertisers are competing for the same inventory. When 50 brands all target “women 25–34 interested in skincare in Jakarta,” the price goes up.
- Q4 is always the most expensive quarter. Holiday season demand floods the auction.
- Over-narrowing your audience shrinks the available pool and forces the algorithm to bid higher.
How to optimize CPM:
- Broaden your targeting. Use Advantage+ Audience with loosened constraints. Give Meta more room to find cheap impressions among people who actually convert.
- Check the Audience Overlap tool. If two of your ad sets are competing for the same people, you’re bidding against yourself. Eliminate duplicates.
- Remember the CTR connection. Higher CTR leads to lower CPM. They’re not independent metrics — they’re mechanically linked through Meta’s quality scoring.
- Test off-peak scheduling. If CPM is eating your budget, try running ads during lower-competition hours. Late night and early morning slots often deliver 15–25% lower CPMs.
What Is Cost Per Result?
Formula: Total Spend ÷ Number of Results
“Result” depends on your campaign objective. For a conversation campaign, it’s cost per conversation started. For lead gen, cost per lead. For e-commerce, cost per purchase. This is the only metric that directly maps to ROI.
Messaging/conversation benchmarks (Indonesia market):
- Travel/Umrah: Rp 25,000–60,000 per conversation started
- E-commerce: Rp 10,000–30,000
- Real estate/finance: Rp 50,000–150,000
Real campaign data (Faaza Travel, May 2026):
- Best performing campaign: Rp 23,000/message (the “Ramah Anak” family-friendly angle)
- Average performers: Rp 40,000–53,000/message
- MOFU awareness campaign: 0 messages — but that’s a different objective, not a failure
The gap between Rp 23,000 and Rp 53,000 is a 2.3× efficiency difference. At scale, that’s the difference between a profitable campaign and one that burns cash.
How to optimize Cost Per Result:
- Choose the right bid strategy. Bid Cap gives you cost control at the expense of volume. Cost Cap optimizes for efficiency while letting Meta flex. Lowest Cost maximizes volume but gives you no ceiling. Start with Cost Cap, then test Bid Cap once you know your target CPR.
- Relevant creative beats beautiful creative. The ad that speaks directly to a pain point will always outperform the one with better production value but generic messaging.
- Build Lookalike Audiences from buyers, not from all engagers. A like is cheap. A purchase is signal. Seed your lookalikes with the highest-intent action available.
- Retargeting pools are your cheapest results. Retargeting typically delivers 40–60% lower cost per result than prospecting. If you’re not running a retargeting layer, you’re leaving the easiest conversions on the table.
How These 3 Metrics Are Connected
Think of it as a funnel: CPM → CTR → Cost Per Result.
CPM determines how much it costs to show your ad. CTR determines how many of those impressions become clicks. And your conversion rate after the click determines your Cost Per Result.
Here’s the formula that ties them together:
Cost Per Result = (CPM ÷ CTR) ÷ 10 × (1 ÷ CVR)
Let’s walk through an example: - CPM: $10 (you pay $10 per 1,000 impressions) - CTR: 2% (20 clicks per 1,000 impressions) - CVR: 5% (1 conversion per 20 clicks) - Cost Per Result = ($10 ÷ 0.02) ÷ 10 × (1 ÷ 0.05) = $10
Now change one variable. Drop CTR to 1%: - Cost Per Result = ($10 ÷ 0.01) ÷ 10 × (1 ÷ 0.05) = $20
Halving CTR doubled your cost per result. That’s why creative testing isn’t optional — it’s the highest-leverage activity in your ad account.
The four scenarios:
| CPM | CTR | Result |
|---|---|---|
| High | Low | Money on fire. Kill the campaign. |
| High | High | Potentially profitable. Audience is expensive but engaged. |
| Low | Low | Cheap reach, bad creative. Fix the ad. |
| Low | High | The sweet spot. Scale this. |
The 4-Week Optimization Framework
Stop optimizing randomly. Use this cycle:
Week 1 — Baseline. Record CTR, CPM, and Cost Per Result for every active campaign and ad set. You can’t improve what you haven’t measured. Export the data. Put it in a spreadsheet. This is your starting point.
Week 2 — Cut the dead weight. Kill any creative with CTR below 1% after 1,000+ impressions. That’s enough data to be statistically meaningful. Don’t be sentimental about ads that took hours to produce. If the audience doesn’t care, the audience doesn’t care.
Week 3 — Reallocate. Shift budget from underperforming ad sets to the ones with the lowest Cost Per Result. This isn’t about impressions or reach — it’s about efficiency. Double down on what’s working.
Week 4 — Test bid strategies. Run a head-to-head comparison: Bid Cap vs. Cost Cap vs. Lowest Cost on the same audience and creative. The results will surprise you. What works for one vertical often doesn’t work for another.
Ongoing: Rotate creatives every 2–3 weeks. Creative fatigue kills CTR silently — your CPM stays flat, your CTR drops, and your Cost Per Result creeps up before you notice. We covered this in depth in our piece on creative fatigue under Andromeda.
The Bottom Line
Three questions. Three metrics.
- CTR answers: “Is my ad interesting?”
- CPM answers: “Is my audience expensive?”
- Cost Per Result answers: “Is any of this actually profitable?”
Don’t try to optimize all three simultaneously. Find the worst one, fix it, then move to the next. If CTR is below 1%, no amount of audience optimization will save your CPM. If CPM is through the roof, broadening your targeting will do more than tweaking your headline.
The advertisers who win on Meta in 2026 aren’t the ones with the biggest budgets. They’re the ones who read these three numbers every morning and make one decision before lunch.